The label “3D traffic sensor” can describe very different outputs: radar detections with range and angle, clustered object tracks, or a denser radar point cloud. Buyers should specify the road decision and exported data rather than assume that every 3D radar behaves like LiDAR or replaces visual classification.
Table of Contents
What “3D” Must Mean in the Specification
A procurement document should name the measured coordinates and output. A radar may measure range, radial velocity, azimuth and, in some architectures, elevation. Its software may export detections, clusters, object tracks, lane events or all four. Marketing often compresses these differences into “3D.”
| Output | What it represents | Useful for | Evidence to request |
|---|---|---|---|
| Detection point | One processed radar return | Diagnostics and low-level fusion | Coordinate definition, update rate, uncertainty |
| Cluster | Related detections grouped together | Object formation | Clustering behavior in dense traffic |
| Object track | Estimated position and motion over time | Lane, queue, speed and trajectory | Track continuity, ID switches, latency |
| Traffic event | Application-level message | Signal control, warning or analytics | Event schema, trigger logic, duplicate handling |
A “point cloud” claim should state point density, coordinate frame, update behavior and whether raw or filtered detections are available. It should not imply LiDAR-like shape detail unless evidence supports that comparison.
Select by Road Decision
Presence at a stop bar, queue length, per-lane count, speed enforcement support, wrong-way warning and conflict analysis are different decisions. Each requires a different detection zone, latency, target-class performance and reference method.
The FHWA Traffic Detector Handbook distinguishes presence from passage sensing and notes that sensor placement affects whether counts and speeds remain valid when queues form. A radar that measures moving traffic well may still fail a stopped-vehicle requirement if its waveform or processing is not designed for presence.
When the road decision is enforcement, sensor acceptance is only one layer. The automated speed enforcement guide adds vehicle association, case evidence, human review, privacy and public-agency oversight.
Write one acceptance statement for each output. “Detect vehicles accurately” is too broad; “report passenger-car presence in the stop-bar zone with the defined miss and nuisance limits” is testable.
Geometry and Occlusion Decide Coverage
Mounting height and angle influence near-field masking, lane separation and the line of sight behind trucks or buses. Curves, crests, roadside furniture and vegetation can create permanent blind zones. A range figure measured against a large vehicle in open terrain does not prove pedestrian or cyclist coverage at an intersection.
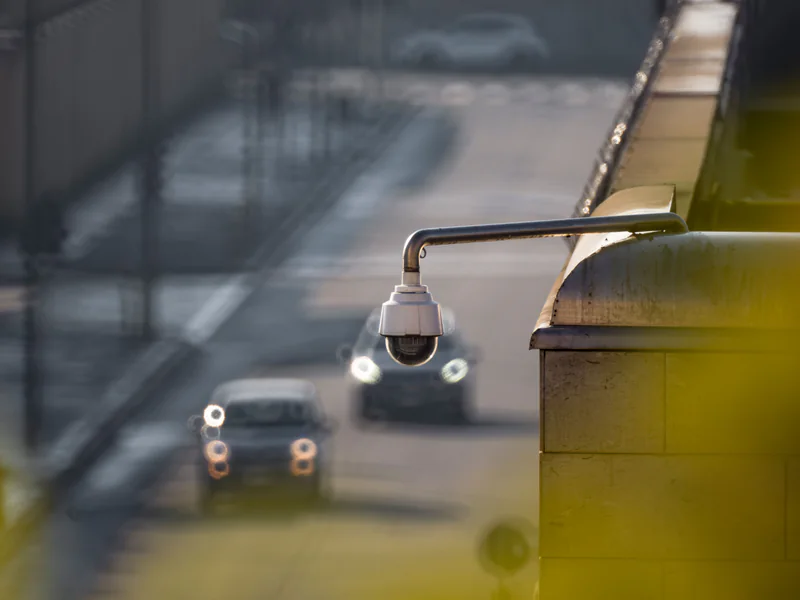
Survey the pole location, approach geometry, likely queues and maintenance access. Simulate or test the largest expected vehicles because their occlusion often defines the practical coverage of smaller road users.
Calibration Is More Than Drawing Lanes
Commissioning begins with measured sensor position and orientation. The lane map then converts radar coordinates into road semantics such as lane, stop bar, crosswalk and conflict zone. Speed and position require traceable references, while class performance needs representative labeled observations.
Verify every lane at near, middle and far range. Include stopped, slow and turning traffic as well as cyclists and pedestrians if they are in scope. Save the configuration and results under version control. A remote edit that changes a zone should create a new auditable version and trigger a defined retest.
Seasonal checks should be risk-based. Pole work, vehicle impact, resurfacing, construction or a sudden change in lane statistics are stronger triggers than an arbitrary calendar alone.
Radar, Video, and LiDAR Trade Different Strengths
Radar supplies direct Doppler velocity and performs without visible light; cameras provide richer visual class and evidence; LiDAR supplies dense geometry at higher data and integration cost. Weather can affect every modality differently, and radar is not immune to multipath, road spray or clutter.
Radar-video products such as the TRVF-8221 pair measurement with visual context. That can simplify event review, but buyers should still request modality-specific performance and a documented degraded mode. The multimodal traffic sensor guide covers the fusion boundary.
Choose the smallest modality set that supports the decision and its evidence requirements. Extra sensors add calibration, cybersecurity and maintenance obligations.
Interface and Lifecycle Requirements
Ask what the device exports: raw detections, tracks, aggregates, relay outputs, standard traffic messages, video clips or a proprietary API. Define timestamps, units, coordinate frame, target IDs, confidence, health and behavior after network loss.
Lifecycle evidence should include signed firmware, support period, configuration backup, spare strategy, recalibration method and remote health indicators. Track counts can look plausible even when a sensor has shifted; health monitoring needs to expose alignment and data-quality anomalies, not only power status.
The radar-video architecture guide provides a reusable data-contract structure for controllers and traffic platforms.
Site Acceptance Before Go-Live
Build a stratified sample by lane, class, movement, light and traffic state. Compare radar speed with a traceable reference, counts with reviewed observations, and zone events with known passages. Test queues, occlusion, night operation, adverse weather when practical, restart and network recovery.
Report misses, false events, lane errors, class confusion, track fragmentation and latency separately. Acceptance is complete only when the system delivers the required event to the consuming controller or platform—not when the vendor dashboard shows a track.
Buyers can compare the current smart transportation portfolio and prepare an evidence schedule through the resource library. For a lane-level configuration and acceptance plan, contact OMNI UXV with the site geometry and required decisions.
FAQs
Is a 3D radar point cloud the same as a LiDAR point cloud?
No. Radar and LiDAR use different sensing physics, resolution, reflectivity, velocity information, and failure modes. Some radars export detection points, but point density and object detail are not directly comparable with LiDAR.
Can one 3D traffic radar cover an entire intersection?
Sometimes, but coverage depends on mounting, field of view, range by road-user class, occlusion, road curvature, and required approach distance. A site survey and lane-level acceptance test must confirm whether one unit is sufficient.
What should be stored after calibrating a traffic radar?
Store mounting position and orientation, firmware and configuration versions, lane and zone geometry, reference measurements, test results, and the date and person responsible. Revalidate after pole work, impact, resurfacing, or unexplained lane-assignment drift.