The 85th-percentile speed is the value at or below which 85 percent of a defined speed sample falls. Vehicle selection, location and traffic conditions shape the result, so report the sampling method and distribution alongside the percentile.
Table of Contents
What does the 85th percentile describe?
It is a value at or below which roughly 85 percent of the defined observations fall, with exact treatment depending on the percentile method and ties. In a free-flow operating-speed study, the target population is vehicles whose speed choice is not constrained by other vehicles or traffic-control devices.
FHWA’s speed terminology distinguishes operating speed under free-flow conditions. A percentile calculated from all traffic during a queue answers a different question, even if the dashboard uses the same label.
Separate measurement from policy. FHWA’s USLIMITS2 description considers operating speeds alongside roadway, crash and pedestrian/cyclist factors. It explicitly says the tool is not a standard or regulation. This article explains data preparation, not how to select a legally applicable posted limit.
Define who belongs in the sample
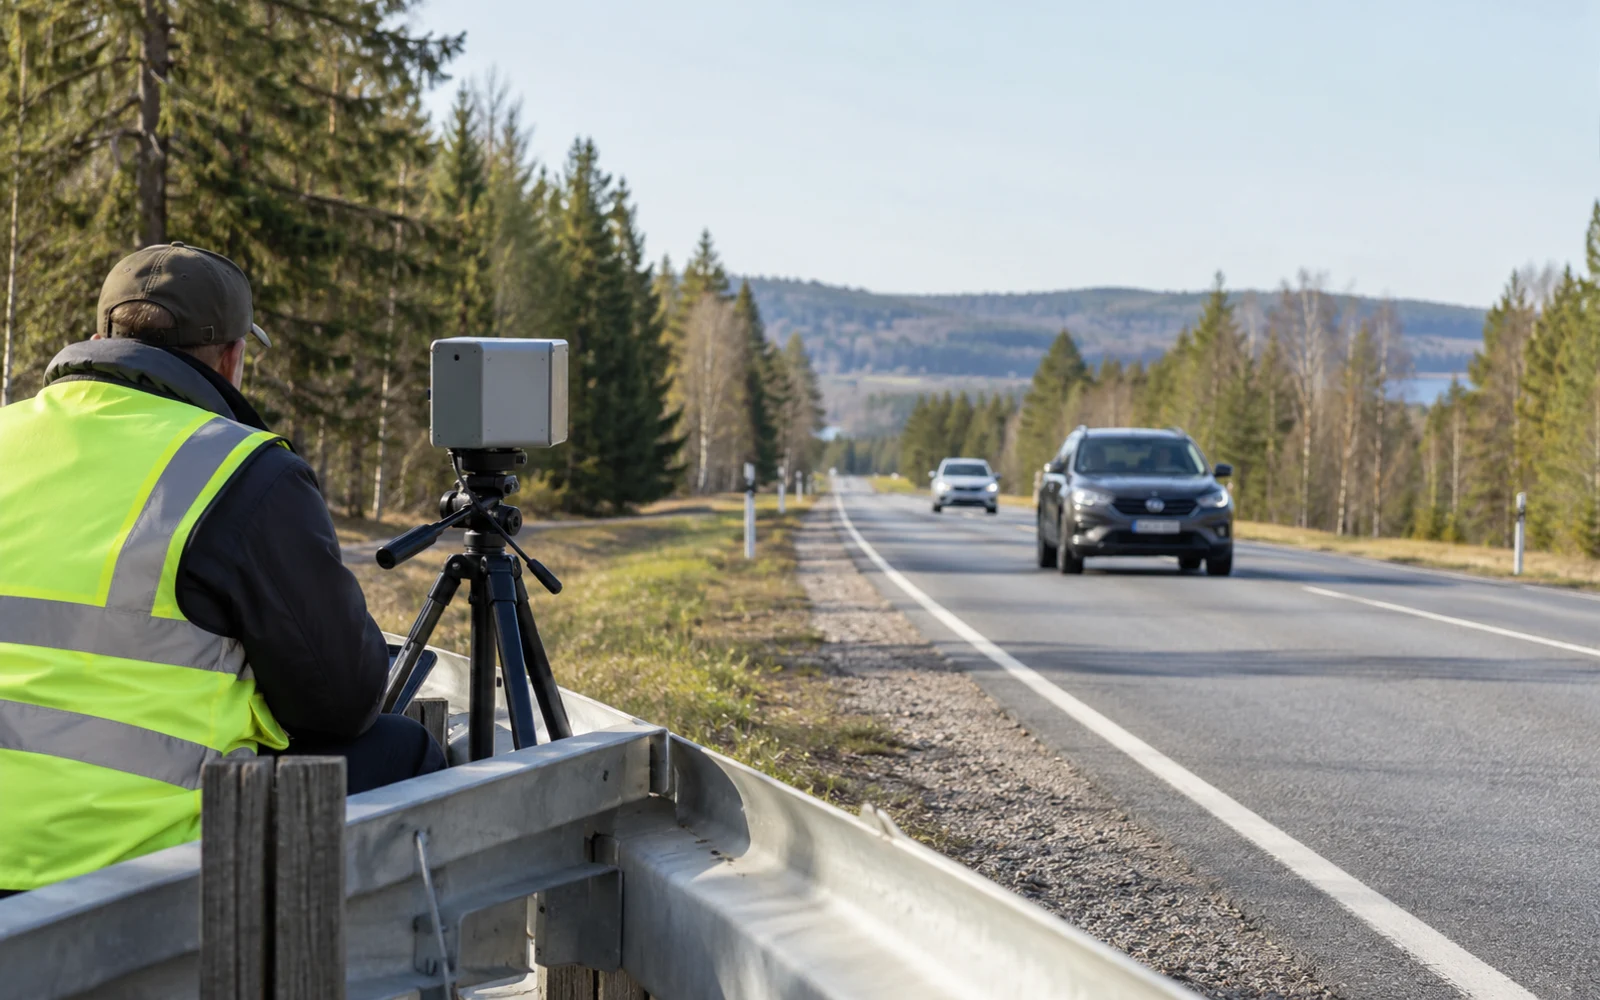
Write the study population before collecting or filtering data. Specify direction, lane coverage, vehicle classes, measurement location, observation period and the intended traffic state. If the study is about free-flow behavior, define how constrained vehicles will be identified under the accepted study method.
A headway criterion may be part of that method, but there is no threshold in this article intended for every road. Document the actual rule and test whether the observations support it. A long gap behind a queue does not necessarily mean the measured vehicle has resumed unconstrained travel.
| Sample field | Decision to freeze | Bias to investigate |
|---|---|---|
| Location | Fixed observation point and surrounding road context | Acceleration, braking or a nearby junction |
| Time | Dates, hours and unusual events | One period presented as all-day behavior |
| Eligibility | Free-flow/all-traffic objective and exclusion method | Selectively dropping low or high speeds |
| Vehicle grouping | Included classes, lanes and directions | Combining populations with different behavior |
| Sensor quality | Validity flags and independent checks | Occlusion, duplicate tracks or geometry errors |
| Calculation | Units, rank/interpolation rule and rounding | Different software returning different percentiles |
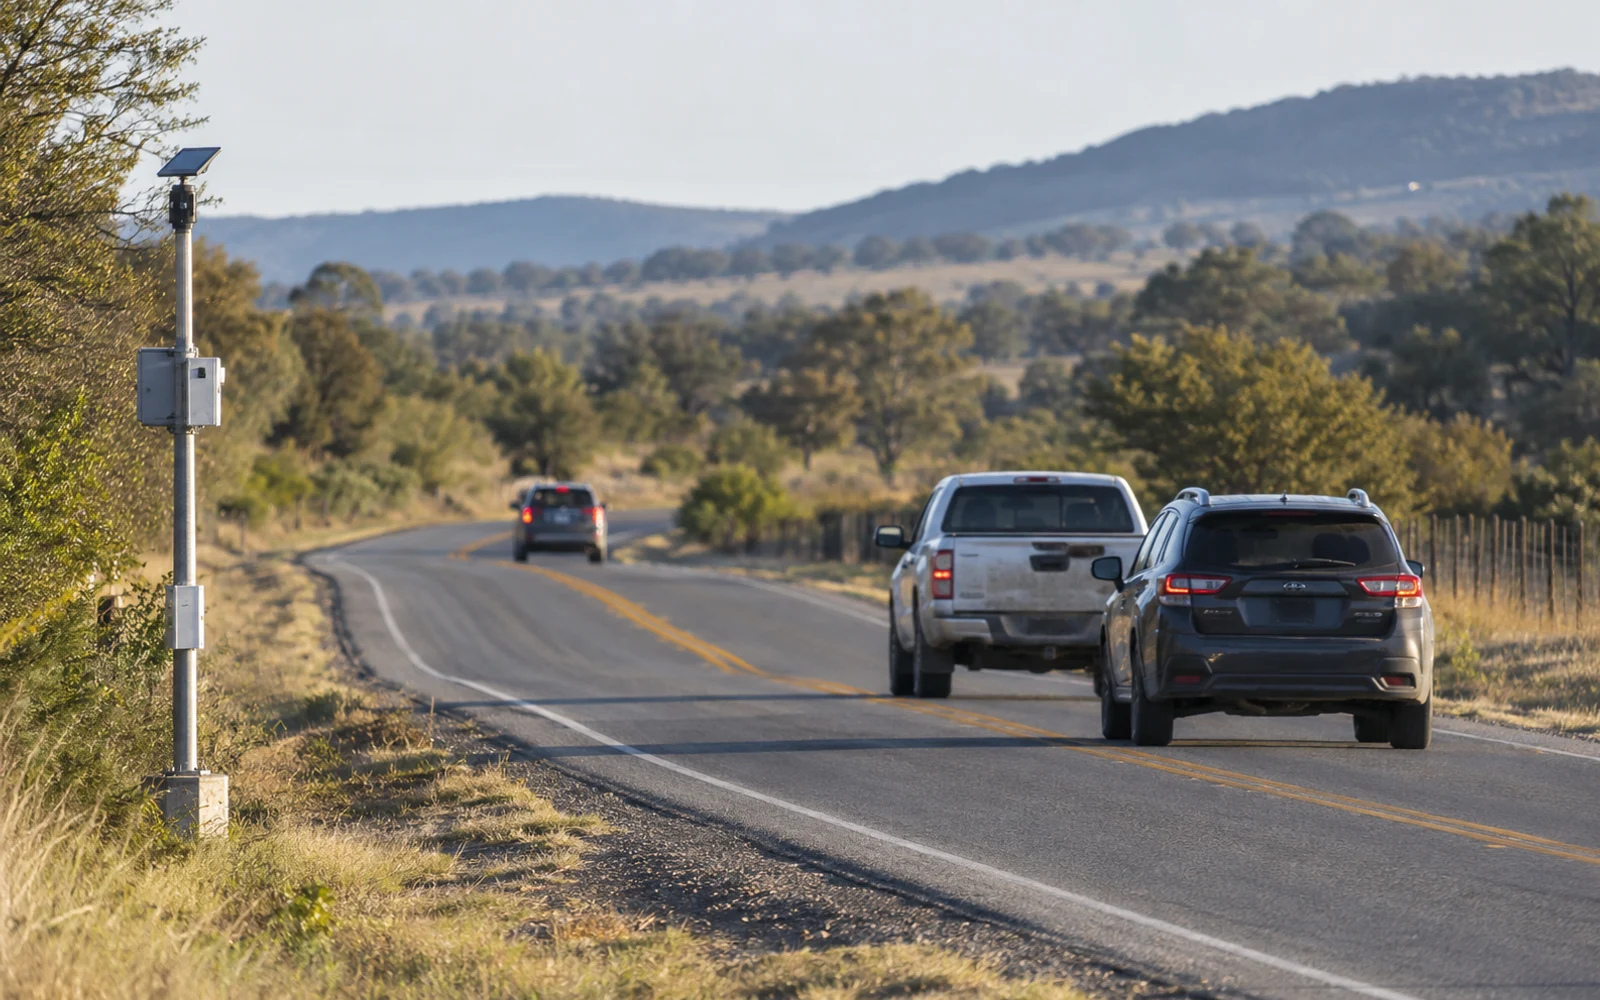
The radar cosine-error guide addresses one measurement issue. A correctly aligned sensor can still produce a biased study if the sample was selected poorly.
Calculate a percentile without disguising the method
As a small arithmetic demonstration, take these 20 invented eligible speeds in km/h, already sorted:
30, 32, 33, 34, 35, 36, 37, 38, 39, 40, 41, 42, 43, 44, 45, 46, 47, 48, 50, 54.
Under the nearest-rank method, the selected rank is the ceiling of 0.85 × 20, which is 17. The reported 85th percentile is therefore 47 km/h. A method that interpolates between ranks can return a different value. State the convention rather than treating the software default as universal.
This 20-value example is not a recommended field sample size. Adequate sampling depends on variability, the study objective and the applicable procedure. Do not round observations early or invent additional precision from a sensor with limited resolution.
Keep the eligible sample count and exclusion count with the result. If the dataset contains ties at the percentile value, explain how the cumulative share is reported rather than implying that exactly 85 percent must lie below it.
Why can two valid studies disagree?
They may represent different drivers or conditions. A school arrival period, a quiet midday window and a weekend event can generate different distributions. A changed vehicle mix, observation point or eligibility filter can also change the percentile without a corresponding change in road geometry.
For before-and-after evaluation, preserve the sampling protocol and disclose unavoidable differences. Review the distribution, not only the selected percentile. A similar 85th percentile can coexist with a different median or high-speed tail.
Investigate data completeness before comparing periods. Missing observations during congestion or sensor overload can change the retained population. Keep invalid measurements distinct from valid slow vehicles, as described in the traffic data-quality guide.
Deliver the distribution, not only one number
Provide the observation window, location, method, eligible count, exclusions, percentile convention and enough anonymized data to reproduce the summary. Include the distribution and limitations relevant to the intended decision.
A speed-study deliverable should identify the sampled population, exclusions and calculation method, so another analyst can reproduce the reported percentile.
FAQs
Does the 85th-percentile speed determine the posted speed limit?
Not by itself. It is one input to an engineering assessment. Road context, safety, vulnerable road users and applicable local requirements also matter; this article does not prescribe a legal limit.
Should vehicles delayed by a queue enter a free-flow speed sample?
A study explicitly targeting free-flow speed should use its documented eligibility rule to distinguish impeded vehicles. Keep exclusions visible and do not confuse that sample with all-traffic operating conditions.
Why can two programs report different percentiles for the same speeds?
Percentile implementations may use different rank or interpolation conventions. Record the method, sample size and input values so the result can be reproduced.