Imaging sonar frequency is only one part of a useful specification. Range, bandwidth, beamwidth, processing and target geometry determine whether an inspection can separate the features that matter. Compare complete operating modes rather than treating the highest frequency or the sharpest display as the automatic winner.
Table of Contents
Does higher sonar frequency always mean better detail?
No. A higher-frequency mode may provide finer detail, but the complete acoustic configuration and the required stand-off matter. A frequency number does not state the smallest feature that an installed system will reliably distinguish.
A concrete manufacturer example helps expose the tradeoff. The Tritech SeaKing ROV/AUV side-scan datasheet lists 325 kHz and 675 kHz modes with different horizontal beamwidths and maximum ranges: 1° and 200 m for the lower-frequency mode, versus 0.5° and 100 m for the higher-frequency mode. The example shows why range and beamwidth should be compared for each complete operating mode.
Do not compare a long-range search mode with a close-inspection mode as if only frequency changed. Record the settings, geometry and output required for each task. The broader ROV and sonar selection guide covers platform choice; this page concentrates on the acoustic mode.
Separate range resolution from cross-range detail
Range resolution concerns separation along the acoustic travel direction. Cross-range detail concerns separation across it. For a conventional real-aperture system, beamwidth and distance influence the illuminated footprint, while pulse design and effective bandwidth influence range discrimination.
For a small angle, a useful beam-footprint estimate is range × beamwidth in radians. An illustrative 1° beam at 20 m spans roughly 0.35 m; at 40 m it spans roughly 0.70 m. That is a geometric footprint estimate, not a guaranteed minimum detectable object size or a complete resolution model.
CHIRP processing is another reason not to equate center frequency with resolution. The Tritech Micron datasheet separately specifies a CHIRP centered on 700 kHz, range resolution and horizontal beamwidth. Ask suppliers to preserve that separation in comparisons.
Display interpolation, sharpening or digital zoom can make an image easier to inspect without creating additional independent acoustic measurements. A screenshot with more pixels is not evidence that two nearby features have been resolved.
Read a dual-frequency specification as two configurations
Create one record per mode. Include operating frequency, bandwidth where provided, pulse settings, beamwidth, selected range, sample spacing, update behavior and processing. Mark unavailable information as unavailable; do not derive it from a marketing image.
Ask what changes when the mode changes. Does the selected range alter sampling or update time? Is the quoted resolution a best-case value? Does the exported file retain settings and navigation? Are two specifications measured using comparable targets?
Also distinguish sonar architectures. A mechanically scanning imager, multibeam imager and side-scan system build their images differently. Do not transplant a side-scan specification into a forward-looking obstacle-inspection requirement without checking what the number describes.
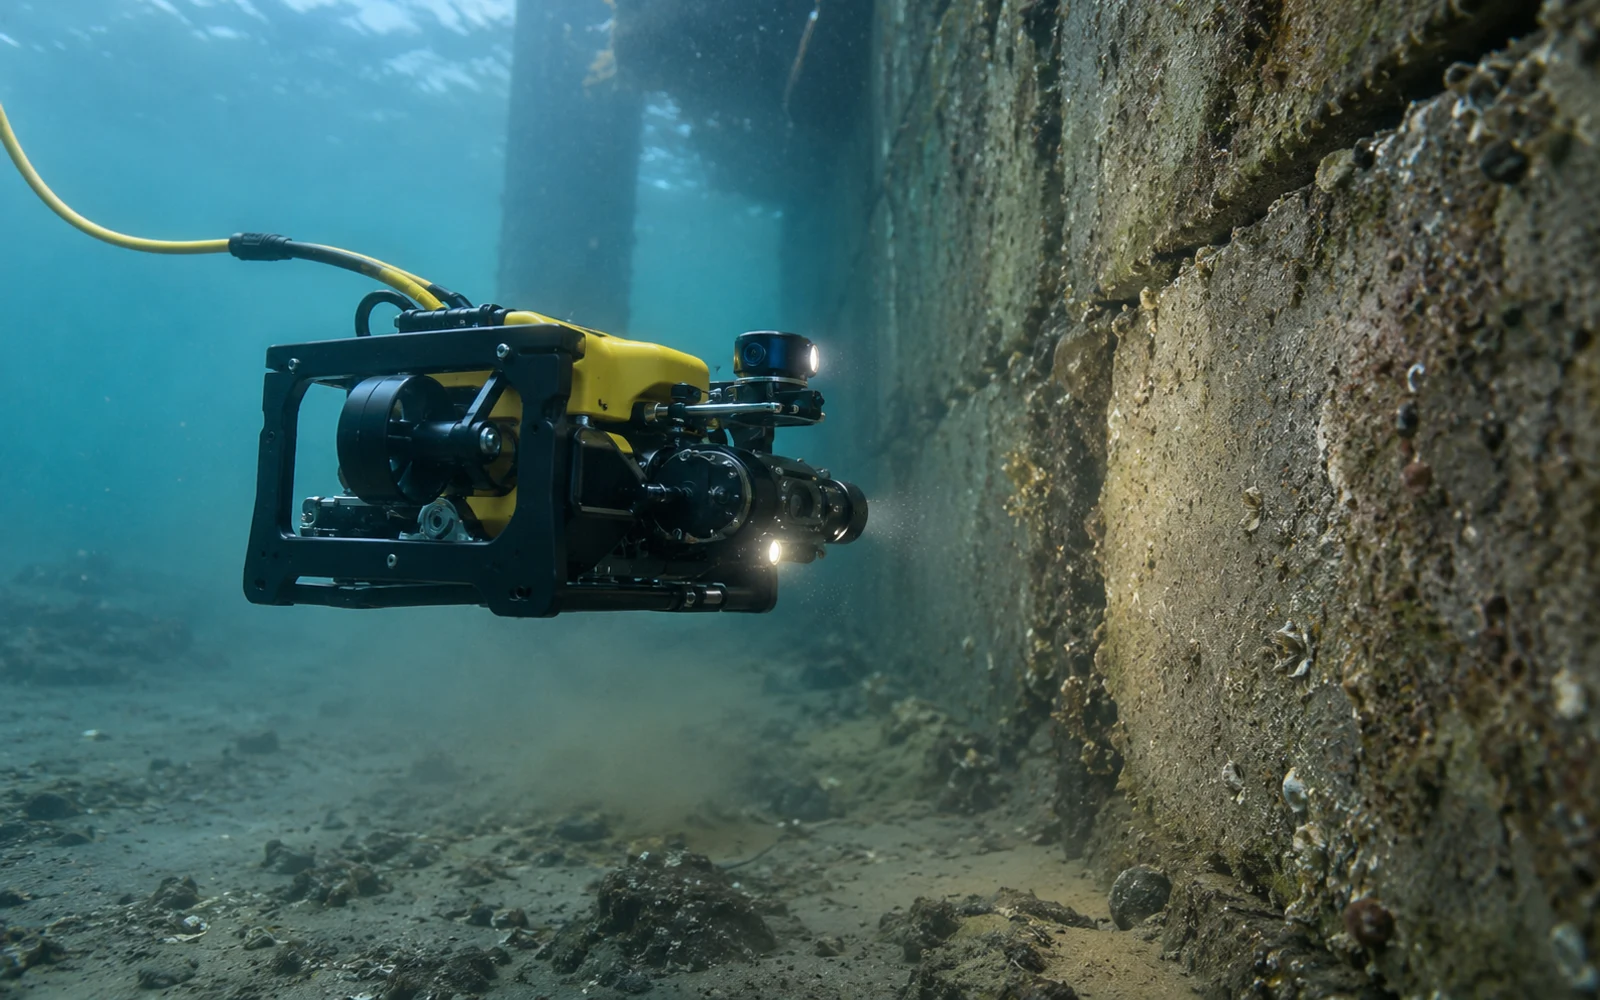
A task-based mode comparison
Use the following editorial comparison framework with the actual equipment documentation.
| Task | Detail that must survive | Mode evidence to request | Misleading shortcut |
|---|---|---|---|
| Locate a candidate object | Contact distinguishable from surroundings | Representative target at the planned search range | Maximum range treated as assured detection |
| Separate adjacent features | Two returns remain distinguishable | Range and cross-range geometry, raw examples | Small display pixels called resolution |
| Inspect a concrete joint | Useful local shape or edge evidence | Short-range view with controlled stand-off and aspect | Frequency alone treated as defect sizing |
| Reacquire a contact | Position and geometry support return visits | Navigation quality, timestamp and configuration | A sharp image without a location record |
| Compare repeat surveys | Changes distinguishable from acquisition effects | Comparable range, aspect, mode and processing | Different gains interpreted as physical change |
Specify the target decision before a demonstration. “Looks clear” is weaker than “the required feature remains distinguishable at this stand-off under these conditions.” Retain failed and ambiguous observations as well as attractive examples.
Validate useful detail at the working stand-off
Plan a bounded evaluation with a known, permitted target and representative water conditions. Log the mode and geometry, repeat observations, and review whether a second operator can make the intended interpretation from the saved data.
Searching, reacquiring and documenting a contact can require different operating modes. Carry each accepted range, beamwidth and resolution condition into the inspection brief.
FAQs
Does higher sonar frequency guarantee finer inspection detail?
No. Frequency interacts with the transducer and operating mode. Useful detail also depends on bandwidth, beamwidth, range, geometry, signal quality and processing. Verify the required target at representative stand-off rather than selecting by frequency alone.
Are sonar display pixels the same as acoustic resolution?
No. A display can interpolate or enlarge samples without adding independent acoustic information. Ask how range resolution and angular detail are defined and validate the underlying data, not just the screenshot.
Can maximum sonar range be used as the inspection range?
Not automatically. A return may be detectable without containing enough detail for the inspection task. Establish the useful range for the target, aspect, water conditions and selected mode during evaluation.